Beyond Returns: Quality Trends Defining CAT Bonds in 2024
In this series on CAT bonds, we’ve explored how this asset class has demonstrated resilience through dynamic shifts in 2023 and steady returns through 2024. In Part 1, we covered the historical performance and stability of CAT bonds, and Part 2 focused on the return drivers supporting robust market activity.
In this series on CAT bonds, we’ve explored how this asset class has demonstrated resilience through dynamic shifts in 2023 and steady returns through 2024. In Part 1, we covered the historical performance and stability of CAT bonds, and Part 2 focused on the return drivers supporting robust market activity.
In this final installment, we analyze the essential quality metrics that define CAT bond risk and performance. From expected loss profiles to trigger types, these factors are essential for investors balancing returns with long-term stability in this growing asset class. As CAT bonds grow in complexity and appeal, a closer look at these metrics offers a deeper insight into the future of this alternative asset class.
Quality is a key factor to the long term sustainability of a healthy market. Therefore, it would be a great interest to understand any shifts in the quality of CAT bonds being underwritten and sponsored. Assessing the quality of any individual CAT bond is an exercise of detailed fundamental analysis that requires a deep dive into the offering memorandum and risk modeling. That said, it is possible to make certain high level assessments when comparing the risk characteristics of a large enough sample of bonds in aggregate. In this case, we compare cohorts of CAT bonds issued in each year from 2021-2024. The key quality characteristics we are going to focus on are,
- Expected Loss profile
- Exposed Peril distribution
- Trigger type
- Exposure Basis
Expected Loss
Perhaps, the most direct indicator of a Bond quality is its Expected Loss (EL). The expected loss metric represents the projected percentage loss for bondholders due to catastrophe events.
As shown in the chart below, there was a marked shift towards the issuance of lower Expected Loss bonds since 2021. This trend, which was already underway in 2022, continued strongly into 2023 and 2024, leading to a meaningful drop in bond issuances with expected loss more than 6%. Among 2024 issuances, almost 80% had an Expected Loss < 3%, compared to ~65% in 2021/2022.
This shift towards lower expected loss reinforces the CAT bond market's appeal to investors focused on balancing returns with manageable risk.
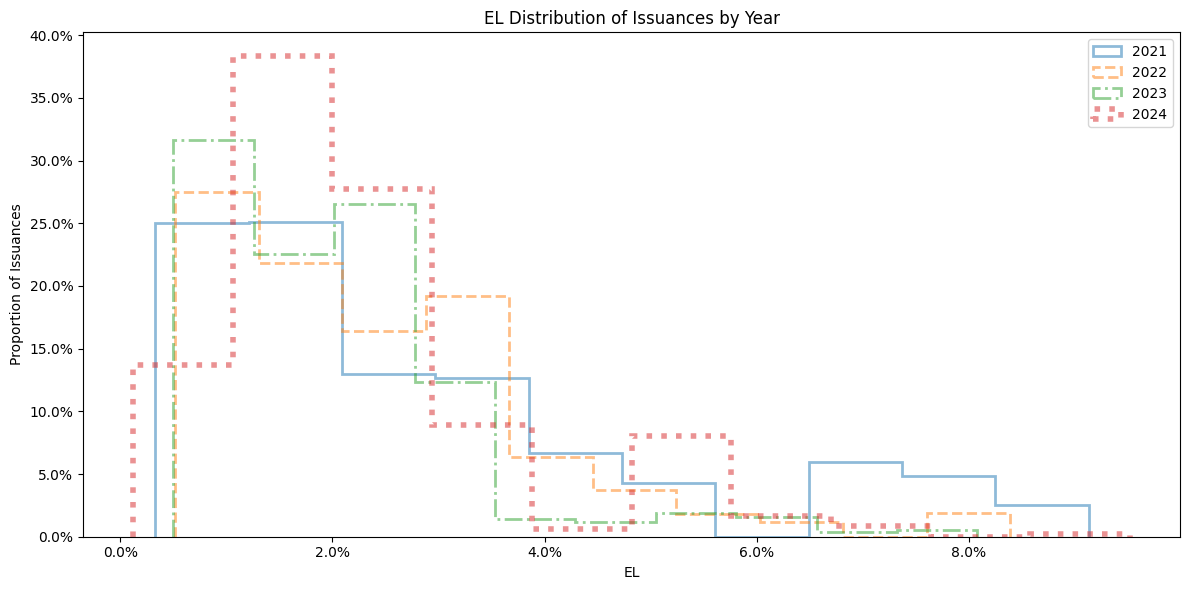
Expected Loss Distribution by Issuance Year
While expected loss provides a baseline for bond quality, understanding the types of perils that trigger these bonds adds further insight into underlying risk profiles.
Peril Distribution
Peril distribution describes the types of events (like hurricanes or earthquakes) that could trigger a bond. Shifting away from multi-peril bonds to single-peril bonds helps diversify exposure, but also increases the concentration of risk in areas like Atlantic wind.
We can observe a few shifts in the nature of these perils in the chart below. During 2021, a significant portion of CAT bonds belonged to the Multi-Peril category (US and Global). Such bonds tend to get triggered by multiple types of catastrophes in a single occurrence or in aggregate. This has the obvious effect of increasing the likelihood of a bond triggering. Since 2021 the share of multi-peril bonds steadily decreased from 27.5% down to ~10%. This has resulted in a marked increase in single-peril bonds. This shift towards single-peril bonds offers investors greater modeling confidence and added flexibility in portfolio construction. However, much of the increase appears to be in Atlantic Wind exposed bonds, which has seen an increase from 36.5% in 2021 to 71.7% in 2024 - an almost doubling! It remains to be seen if this is a trend or a coincidence due to bond issuance cycles. If it is indeed a trend that is here to stay, it could point to concentration issues which may need adept management.
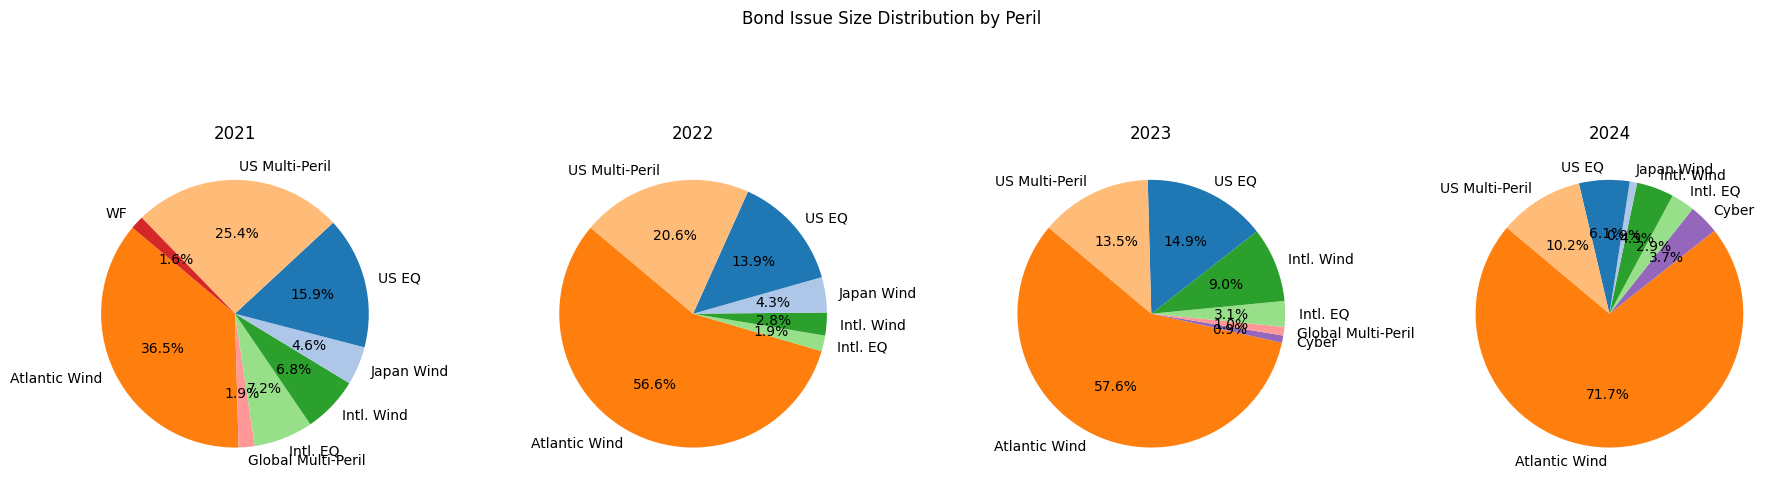
Peril Distribution of Bond Issuances By Year
The increase in single-peril bonds—particularly in Atlantic wind—indicates a specialization trend, although it underscores the need for diversified portfolio construction.
Atlantic Wind Bonds
Once we disaggregate the Atlantic Wind Bonds in subgroups we notice some interesting trends. The proportion of bonds with US WS nation-wide exposure is much lower than in prior years. Since these bonds have nation-wide exposure, they can be triggered by hurricane events across the entire US coastline as opposed to bonds that are restricted to specific subregions. We notice that there has been a marked increase in Gulf WS bonds, which cover exposure in TX, LA and other Gulf of Mexico states. The proportion of FL exposed bonds is slightly lower than 2023. These relative proportions must be viewed in the context that the overall share of Atlantic WS bonds has increased and also note any forthcoming issuances will impact the final picture.
The key message here is that even though the overall Atlantic Wind exposure in 2024 is higher, there continues to be diversification potential within Hurricane exposed bonds. That said, while the uptick in Atlantic Wind exposure provides targeted opportunities, it also necessitates careful management to avoid undue risk concentration
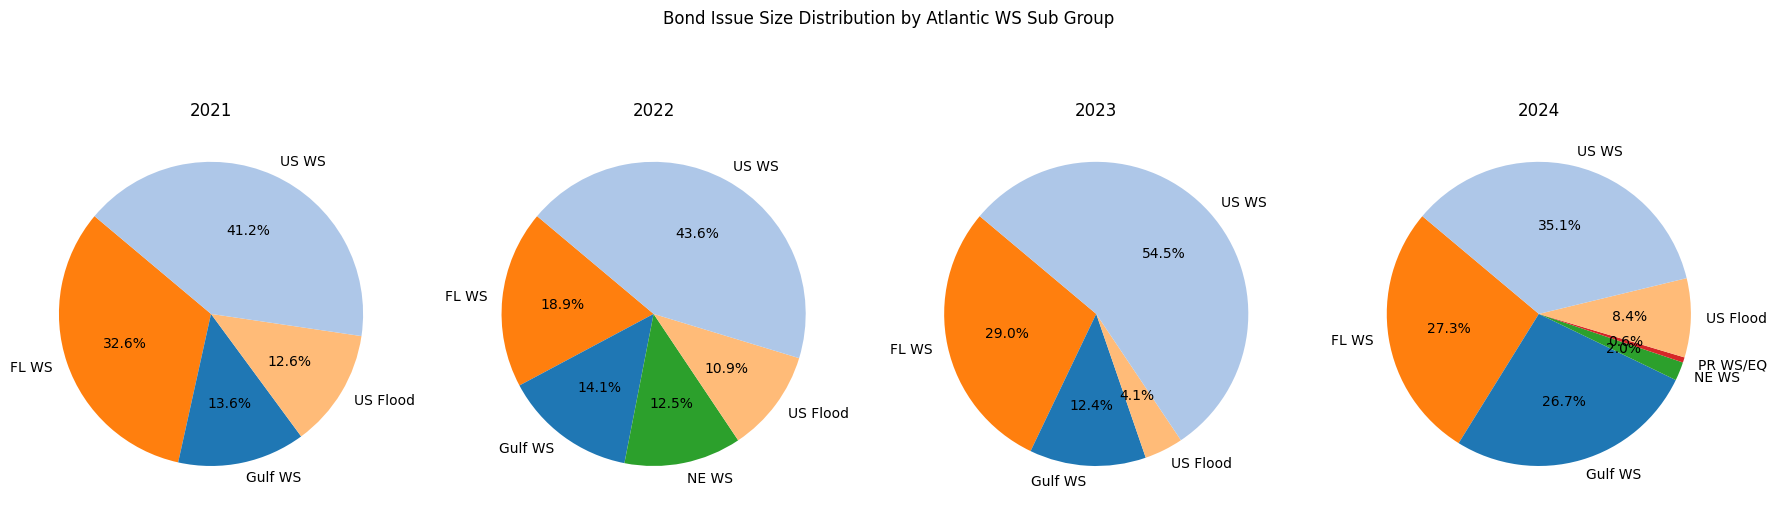
Atlantic Wind Sub-Peril Distribution of Bond Issuances By Year
While perils indicate where risks lie geographically, trigger types determine how these risks are quantified and responded to, offering another layer of complexity in CAT bond structure.
Bond Triggers
Trigger type defines when a bond pays out—either after a single large event (Occurrence) or several smaller events (Aggregate). The preference for Occurrence triggers reflects investor favorability toward well-modeled, lower-risk triggers. Aggregate bonds, on the other hand, have had relatively poor experience and the risk modeling is not as mature. We notice that a greater share of 2023 issuances were based on an Occurrence trigger, which was a favorable trend. In 2024, while it does appear that Aggregate bonds have the same Notional amount as 2023, the relative share of the total cohort appears to have increased to ~48%, which is a reversal of the favorable trend seen in 2023. It remains to be seen if the Q4 2024 new issuances will change the narrative.
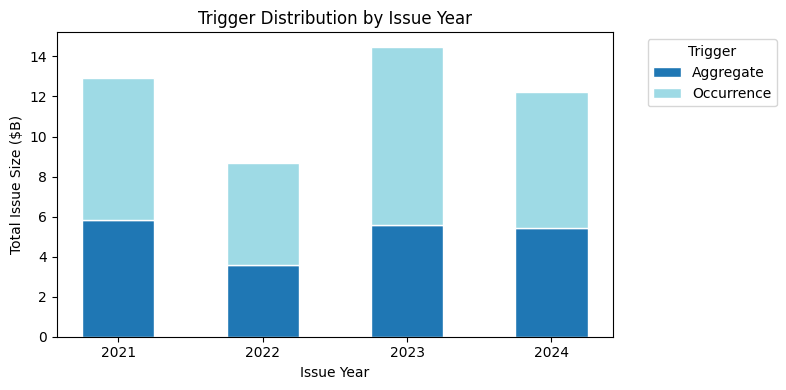
Trigger Distribution of Bond Issuances By Year
The choice of trigger type influences the bond’s risk profile, with occurrence triggers generally offering greater investor security. Beyond event triggers, the exposure basis of a CAT bond—whether based on actual losses or broader indices—adds another layer of specificity, influencing both risk management and investor appeal.
CAT Bond Exposure basis
CAT bond exposure can be ‘Indemnity-based’ (actual loss) or ‘Index-based.’ Although indemnity bonds align with actual losses, index or parametric triggers are generally more liquid and attractively priced, which also has implications for secondary market trading.
For obvious reasons, sponsors prefer the exposure basis to be based on their actual loss - it eliminates basis risk. That said, from a risk taker's perspective, information asymmetry and modeling challenges make Indemnity exposure less desirable to either index or parametric exposure. Index and parametric triggered bonds tend to be more liquid and price more favorably. However, as seen in the chart below, it does look like Indemnity exposure basis continues to be the most prevalent choice in 2024 new issuances. This is a quality factor that has not changed favorably and we need to continue to watch how it evolves in the future.
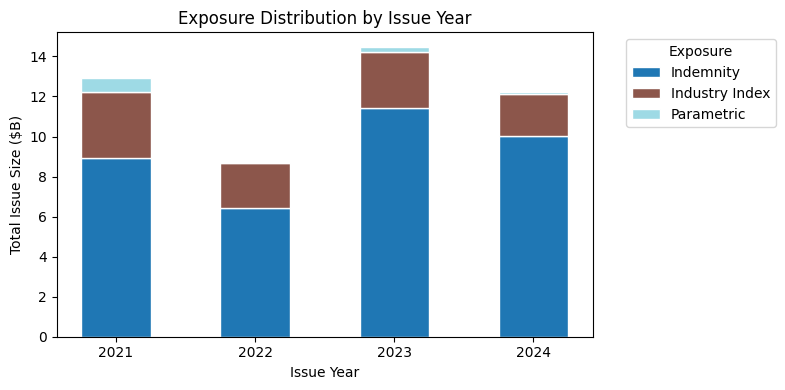
Exposure Distribution of Bond Issuances By Year
Understanding the impact of indemnity versus index exposures will be critical for investors navigating liquidity and pricing in the evolving CAT bond landscape.
Conclusion
The 2024 CAT bond market continues to evolve, shaped by quality metrics like expected loss profiles, peril exposure, and trigger types. As these factors shift, they redefine the potential and risks for investors. While shifts toward lower expected losses and diversification in peril types provide a more secure foundation, areas like concentrated exposure in Atlantic Wind bonds and the increasing share of aggregate triggers may introduce additional risk factors.
CAT bonds’ resilience amid market uncertainties maintains their appeal, yet evolving trends call for more nuanced pricing models and thoughtful diversification. As we close this series, it’s clear that CAT bonds offer a unique blend of risk and reward in the alternative investment space, one that demands a keen understanding of evolving market dynamics.